Pacific Northwest Estate Market & Value · Benewah Estate
The Buyer
Who Finds This
Property First.
Buyers relocating from high-cost Western markets arrive with an understanding of what comparable land costs at home. They recognize the valuation difference quickly—and understand what the same capital commands here.
California
Primary Market · 21.2%*
$3.5M–$7.5M+ Premier-Market Range
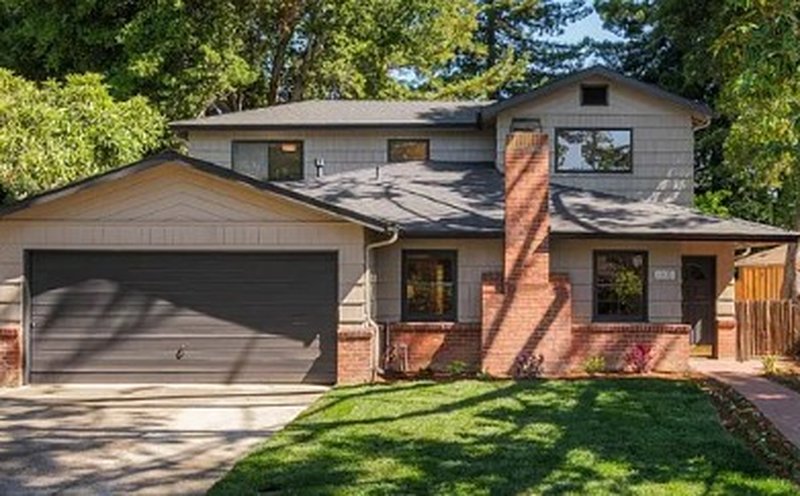
Sold example · $5.0M · 2,203 sf · $2,270/sf · 0.165 ac · $30M/acre · May 2026
Buyers exiting Palo Alto, Marin, or coastal Southern California recognize immediately how much more land, privacy, water, and view protection the same capital can command in North Idaho.
Washington
Regional Market · 24.5%*
$2.2M–$4.5M+ Premier-Market Range
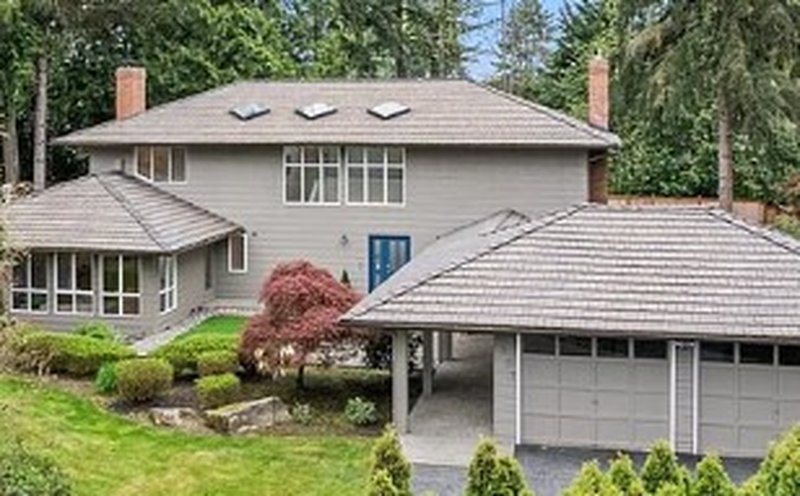
Sold example · $2.93M · 3,070 sf · $954/sf · 0.379 ac · $8M/acre · June 2026
Medina, Mercer Island, and Eastside buyers routinely carry multimillion-dollar housing price levels. North Idaho translates that capital into materially greater scale, privacy, and flexibility.
Oregon
Western Market · 5.8%*
$1.5M–$2.8M+ Premier-Market Range
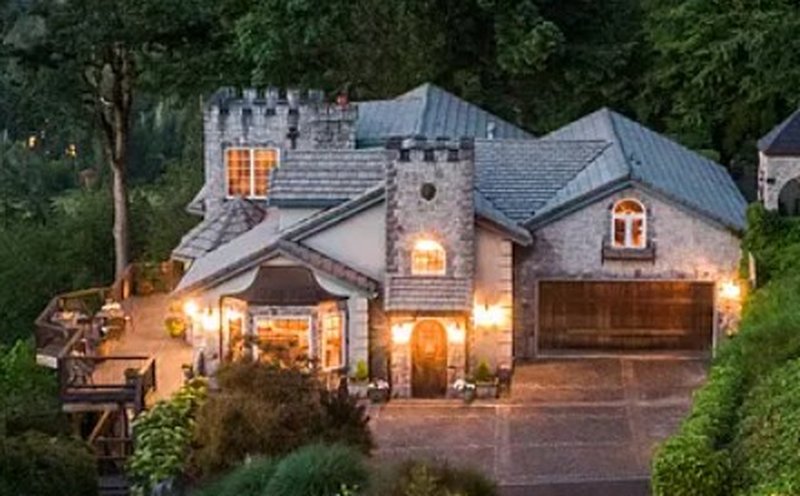
Active listing · $2.295M · 4,872 sf · $471/sf · 3.56 ac · $645K/acre
For buyers from Lake Oswego, Dunthorpe, or Bend, the comparison is not the statewide median. It is the land, independence, and optionality obtainable at a similar basis.
Colorado
Mountain Market · 3.2%*
$2.0M–$5.0M+ Premier-Market Range
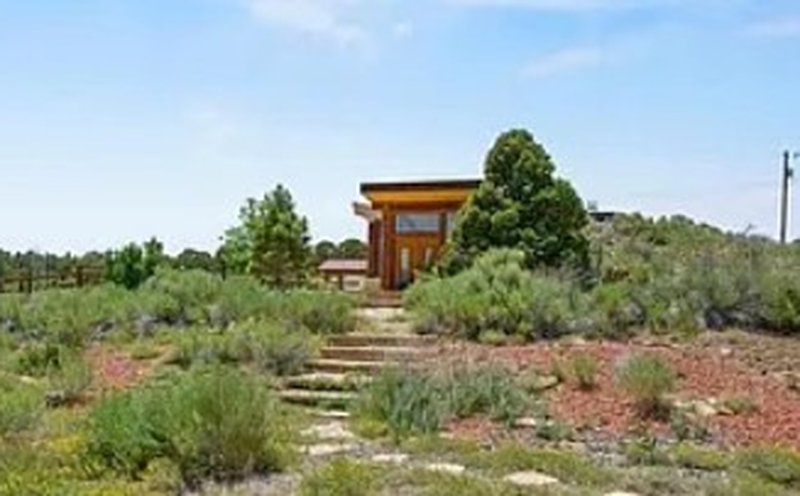
Active listing · $2.395M · 4,016 sf · $596/sf · 90 ac · $26.6K/acre
Buyers from Boulder, Cherry Hills, and the mountain-resort corridors already understand the cost of terrain, views, and outdoor access. North Idaho offers a familiar asset profile without the mature resort-market premium.
*Percentage represents each state’s share of Idaho’s 2024 interstate arrivals. Together, California, Washington, Oregon, and Colorado accounted for 55% of arrivals. Price ranges are representative of premier submarkets—not statewide medians.
Buyers from these markets often recognize the valuation advantage before the local market fully reflects it. The opportunity is greatest while that gap remains.
The Regional Arc
Destination Markets
Are Decades in the Making.
Whitefish Mountain Resort opened in 1947; however, it would take another 40 years—around the time the Coeur d’Alene Resort opened in 1986 and Schweitzer began expanding—before these resort towns gained the notoriety they enjoy today. From 1980 through 2026, population in these areas more than doubled while home prices and land values rose dramatically, fueled in part by equity migration from higher-cost Western metro areas.
The Market Evolution
Today’s Resort Markets
Began as Working Towns.
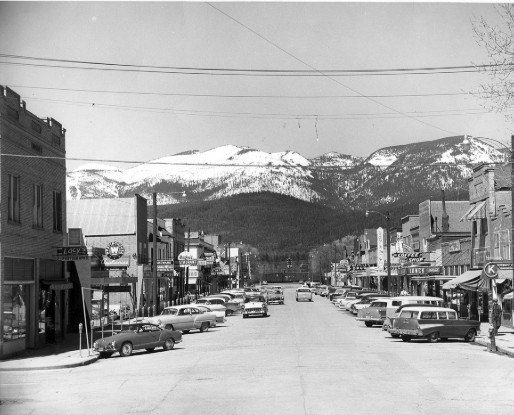
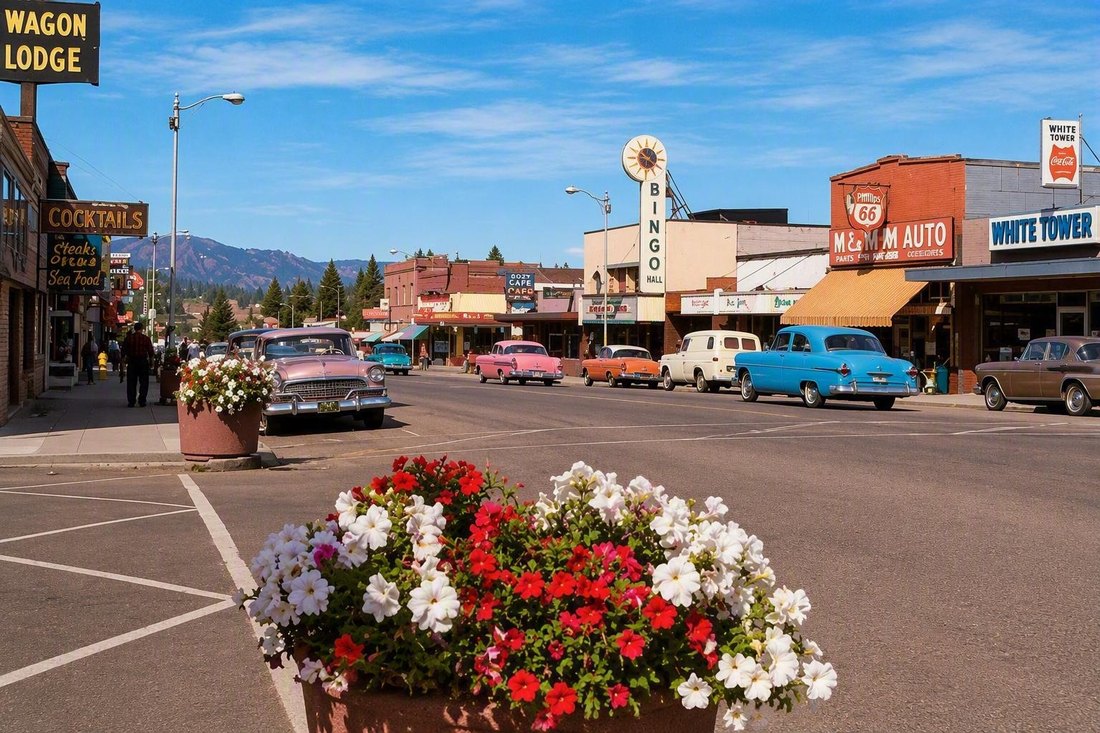
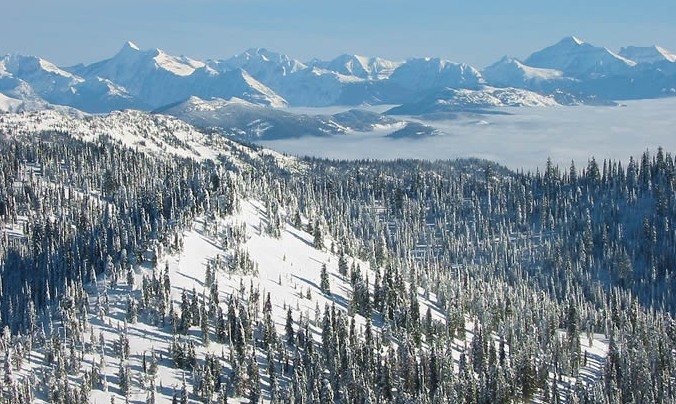
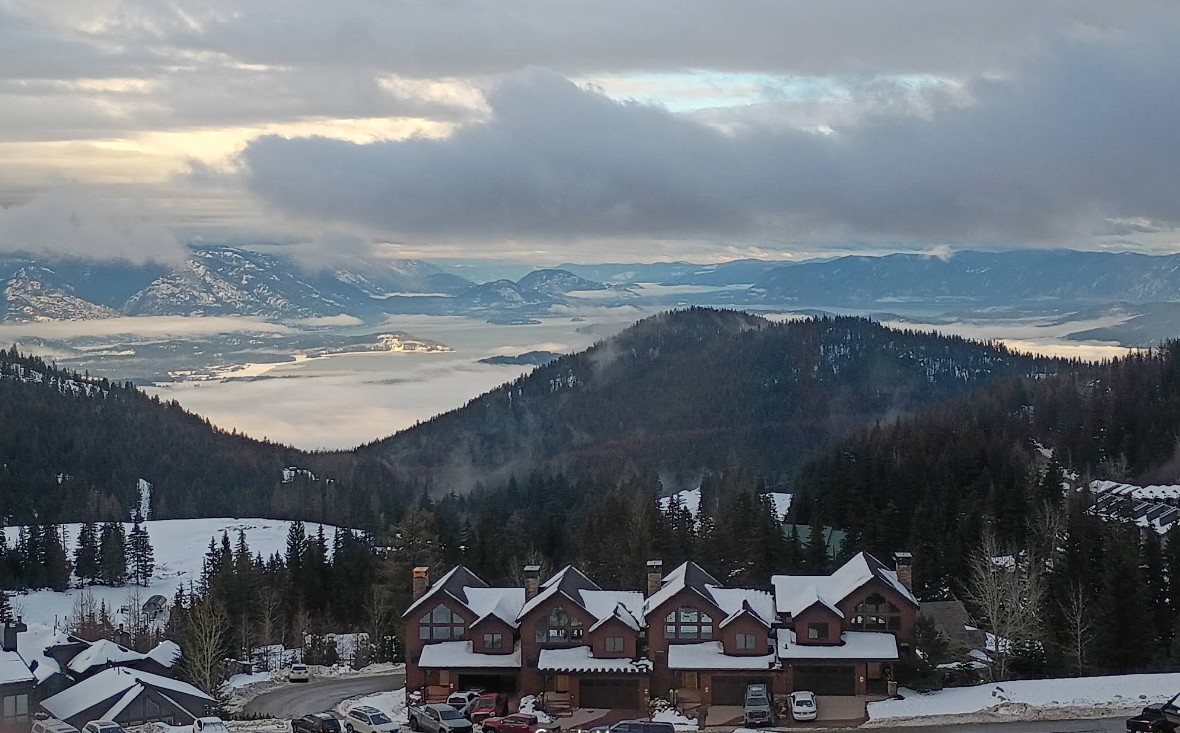
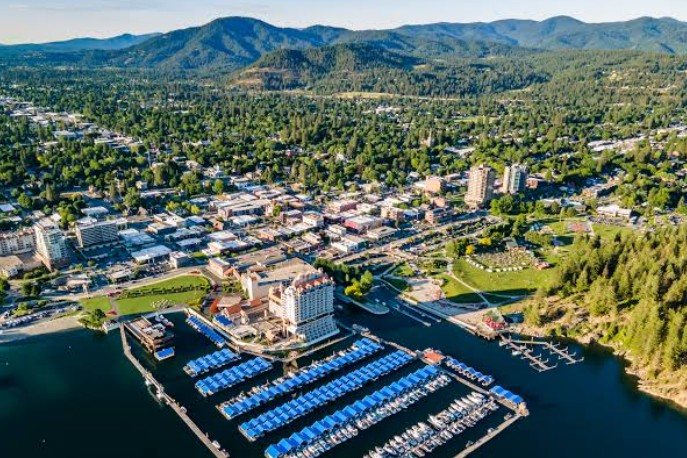
California’s hard hitting early 1990’s recession triggered one of the state’s first major equity-migration waves into the Pacific Northwest. At the time, Coeur d’Alene, Sandpoint and Whitefish were small towns, all beginning as lumber, rail, and regional outdoor-recreation hubs uncannily similar to St. Maries today.
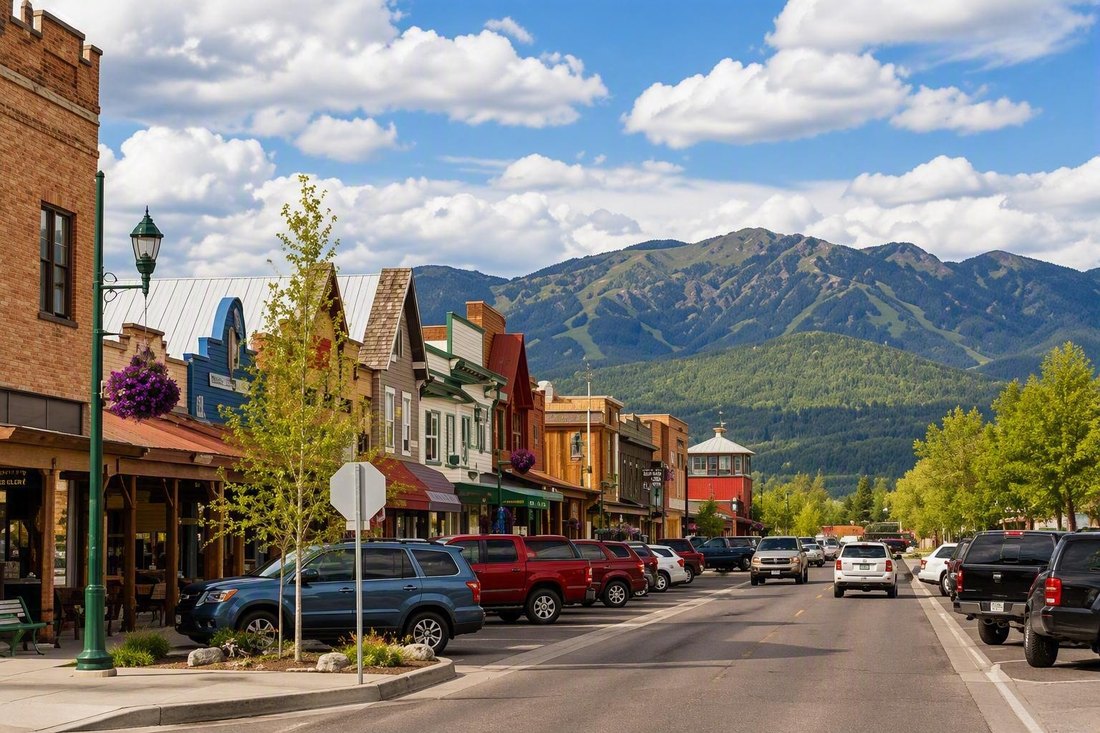
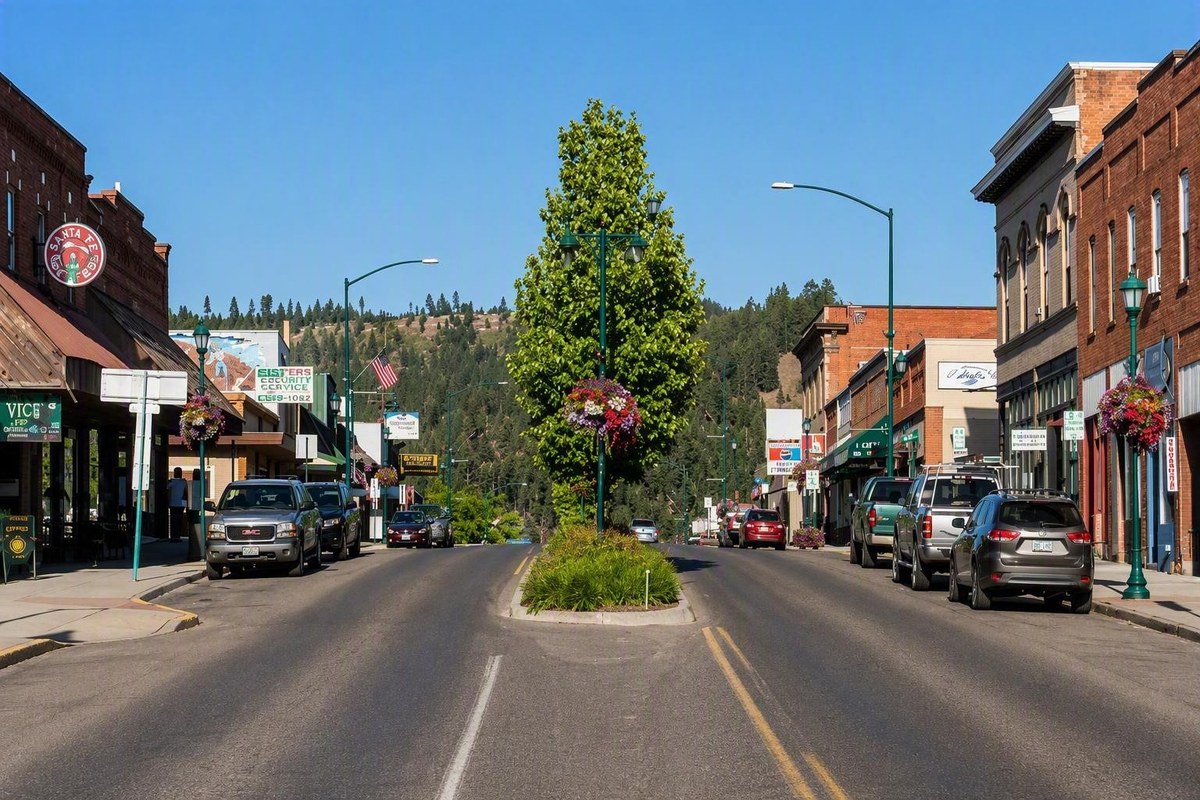
Indeed, St. Maries’ working-town charm resembles an earlier stage of Whitefish’s development (see photos, right).
Today, these markets have matured into premium resort areas.
The Resorts
The Value Advantage
St. Maries Kept Pace.
Earlier in the Cycle.
Coeur d’Alene, Sandpoint and Whitefish exemplify the intersection between exceptional natural settings, growing national recognition and a finite supply of desirable land. As prices rose and meaningful acreage became harder to obtain, demand did not disappear. It expanded outward.
Subdivision density absorbed close-in land, drove per-acre values higher and reduced typical parcel sizes. As supply tightened, high-net-worth buyers broadened their search north toward Sandpoint and east toward Whitefish. Eventually, affordability pressures extended that search south to St. Maries, a small town at the confluence of the St. Joe and St. Maries rivers. The data to the right show St. Maries participated in the same regional appreciation cycle.
As established Pacific Northwest hubs became more expensive, buyers increasingly looked outward for scale, water, privacy and usable land. St. Maries’ real estate appreciation has occurred not apart from those destinations, but as a consequence of their success. Because St. Maries remains earlier in its market development, more of a buyer’s capital remains concentrated in the property itself—its acreage, water, views, privacy and improvements—rather than being absorbed by the resort-market premiums attached to established regional hubs.
Thus, St. Maries is not a market left behind—far from it. Rather, it is one that has kept pace with some of the hottest markets in the Pacific Northwest. As affordability pressures continue to push buyers beyond established hubs, St. Maries remains well positioned.
2000–2026 Market Data
| Market | Residential $/sf 2000 → 2026 |
Change | St. Maries as % of Market* |
Large-tract $/acre 2000 → 2026 |
Change | St. Maries as % of Market* |
|---|---|---|---|---|---|---|
| Coeur d’Alene | $85 → $355 | 318% | 127% | $6,000 → $48,000 | 700% | 83% |
| Post Falls | $92 → $355 | 286% | 141% | $5,500 → $44,000 | 700% | 83% |
| Sandpoint | $80 → $365 | 356% | 113% | $4,500 → $40,000 | 789% | 74% |
| Whitefish | $110 → $540 | 391% | 103% | $8,500 → $70,000 | 724% | 81% |
| St. Maries | $50 → $252 | 404% | — | $1,200 → $8,200 | 583% | — |
Regional appreciation reflects observed 2026 market benchmarks. Property-level valuation below uses a more conservative $7,500/acre large-tract rate for 100–120-acre properties to reflect current liquidity at the upper end of the St. Maries market.
*Compared with Coeur d’Alene/Post Falls, St. Maries residential appreciation from 2000–2026 was 404% versus 318% and 286%, respectively—127% of Coeur d’Alene’s appreciation and 141% of Post Falls’. Large-tract appreciation reached 83% of both markets. In 2026, St. Maries $/SF remains 29% below Coeur d’Alene/Post Falls ($252 versus $355), while its $8,200/acre large-tract benchmark remains at roughly one-fifth of their $44,000–$48,000/acre levels. Together, these create one of the few value opportunities in the region where the land’s inherent beauty and access to water features remain early in the appreciation cycle.
The Value Gap
Less Resort Premium.
More Property to Enjoy.
In Pacific Northwest markets examined here, buyers seeking meaningful acreage frequently encounter one of two compromises: pay $1M+ for a finished residence on a smaller parcel—often within a development where neighboring homes limit privacy and control the foreground, preventing long sightline views; or acquire raw land and assume the cost, time, and risks that accompany development.
St. Maries occupies a space between these alternatives. Because less of the acquisition price is consumed by destination-market premiums and resort proximity, more capital remains for acreage, water, privacy, views, wildlife habitat, etc.
The difference is not that established resort markets lack value. Market premiums reflect genuine value. The distinction is for buyers who prefer to allocate capital differently.
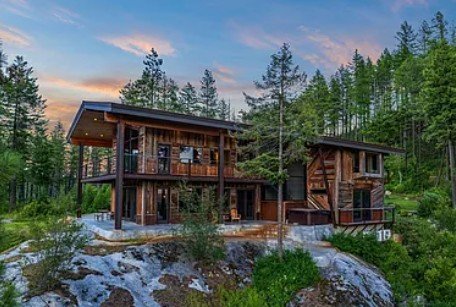
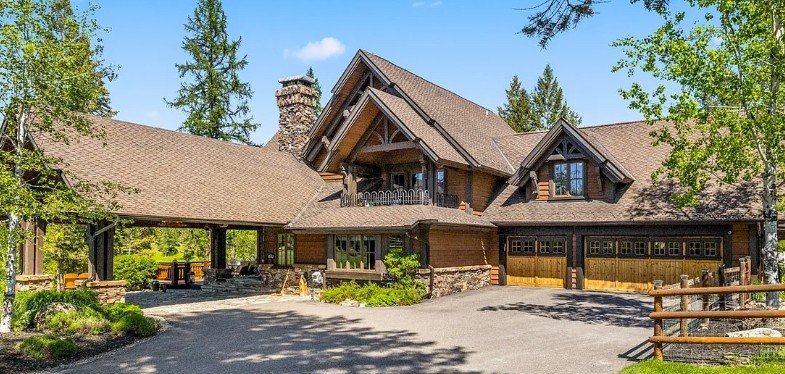
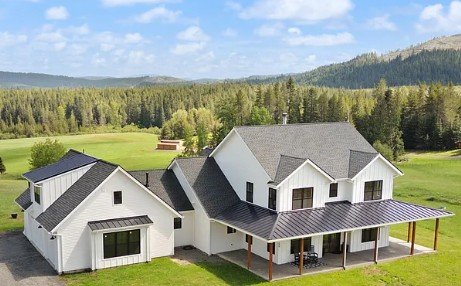
St. Maries Comps
The Saint Maries Market
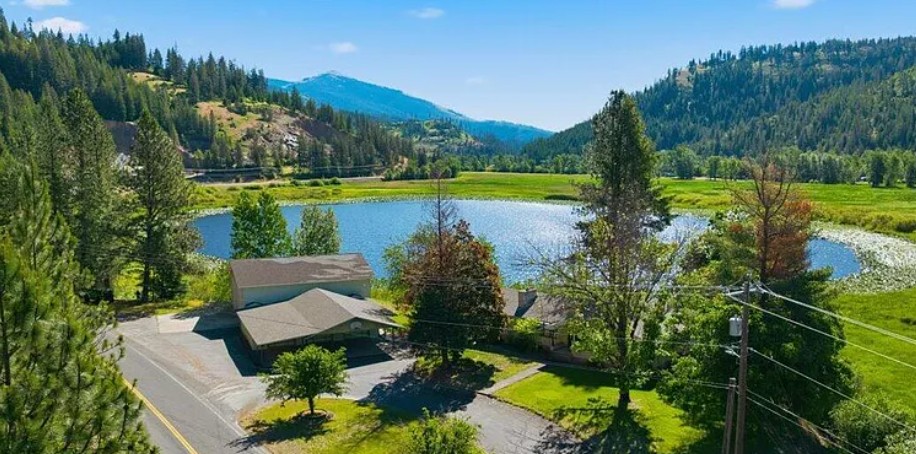
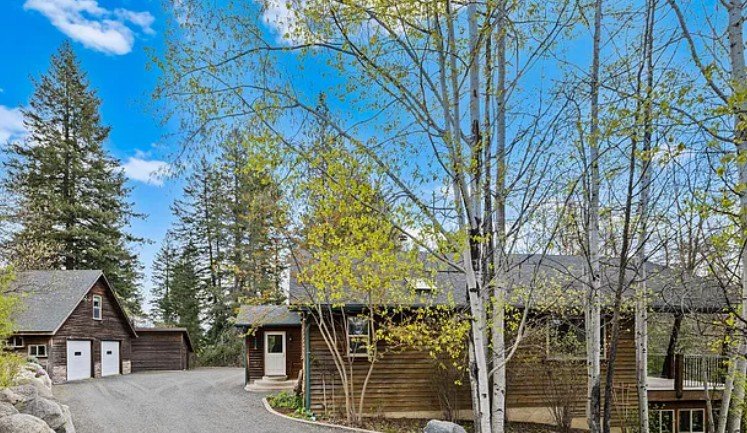
2035 St Joe River Rd
$825,000
3,646 SF · $226/SF · 2.3 Acres · $359K/acre
Built 1970 · Partial Update Reported 2015
View on Zillow →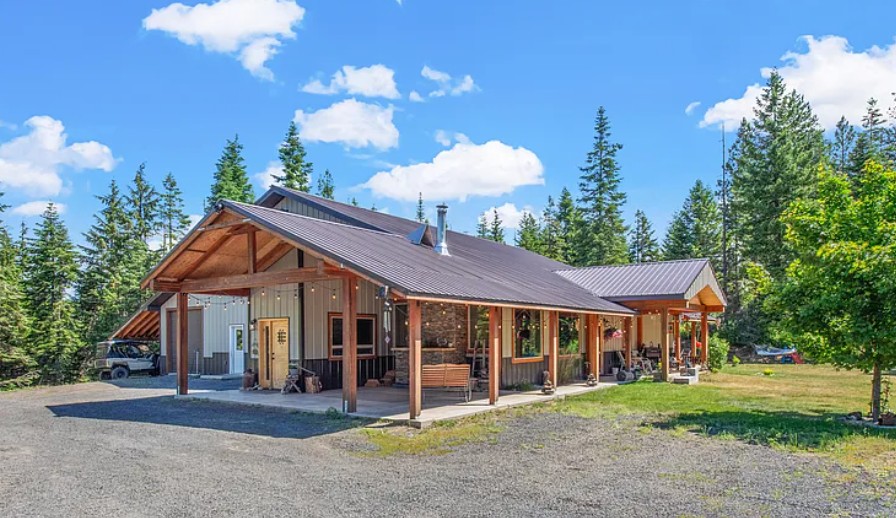
1124 Bugle Point Rd
$1,200,000
2,928 SF · $410/SF · 20 Acres · $60K/acre
Built 2020
View on Zillow →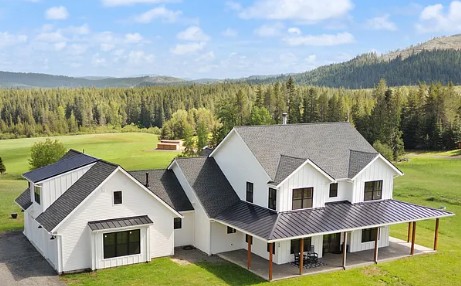
88 Alder Creek Loop Rd
$2,200,000
3,624 SF · $607/SF · 100 Acres · $22K/acre
Built 2022
View on Zillow →Anatomy of the Ask — Methodology
Unlike more densely populated areas where neighborhoods are homogeneous pools of comparable homes of similar lot sizes and structures, enabling application of a single headline $/SF to estimate market value, with minor adjustments for upgrades like granite in the kitchen or a backyard deck; areas like St. Maries, where acreage varies widely and most structures are custom built, make a single flat rate less useful. And yet, market averages are the most publicly available metric. The key then becomes how they’re applied.
This analysis uses the most recent market averages for properties sold across the St. Maries market, with the understanding a headline $/SF applied to higher-value residences on larger acreage understates the residence’s market value and increases the difference between list price and total market-average value, unless the acreage is separately assessed. Accordingly, to avoid understating market value, this analysis separates the land’s market value and adjusts for any view premiums that might exist.
Market-averages were pulled from St. Maries’ latest market data by acreage to establish a base layer value for land, with and without unique views. Photos were then used to assess unique land views and market values were again referenced to assign a premium to those views. Why weren’t photos used to assess residence differences, additional structures, etc.? Because this is a directionally accurate analysis of market value. It is not an appraisal. Not only are the authors not licensed appraisers, but there are far too many nuanced features not disclosed on public MLS listings, known only by the seller. Moreover, those differences, as to residence finishes, trim materials, etc. and overall aesthetic appeal, vary widely across buyers and are ultimately dependent upon highly subjective buyer preferences.
In summary, the analysis contains 3 components:
- Residence at Market: residence SF x the most recent market-average $/SF for St. Maries homes sold in 2026.
- Land at Market: acreage x the most recent market-average $/acre for St. Maries land sold in 2026.
- View Premium: additional land value where acreage contained a photographed unique view, likewise evaluated against market values for sold properties with similar views.
Items 1–3 were then summed to compute Total Estimated Market Value. The difference between Total Estimated Market Value and List Price is then the residual above or below the total market average.
As inferred above, it should be noted residual value may include additional structures, finish quality and aesthetic appeal, condition, landscaping, water features and other property-specific distinctions that cannot be quantified from public listing data alone. Thus, it is understood legitimization of the residual from these more nuanced distinctions must be left to interested buyers and sellers to value as part of final sale negotiations.
Market Value Estimate vs. List Price
| Listing | Residence at Market Avg | Land at Market Avg | List Premium | |||||||||||
|---|---|---|---|---|---|---|---|---|---|---|---|---|---|---|
| Address | Year Built | List Price | Residence SF | $/SF | Market $/SF | Residence At Market Avg |
Acreage | Mkt Avg $/acre | View Premium |
Total $/acre | Land Market Value |
Total at Market Avg | List Premium |
Premium |
| 1970 (56 yrs) | $825,000 | 3,646 | $226.28 | $150* | $546,900 | 2.3 | $10,000 | $69,000 | $40,000 | $92,000 | $638,900 | $186,100 | 29.1% | |
| Detail | Acres | Base Rate | Premium | Total Rate | Land Market Value | |||||||||
| Land at Market Avg | 2.3 | $10,000 | — | $10,000 | $23,000 | |||||||||
| View Premium · River View | 2.3 | — | $30,000 | $40,000 | $69,000 | |||||||||
| Land Subtotal | 2.3 | $92,000 | ||||||||||||
*Residence valued at $150/SF rather than the $252 market average, reflecting the 1970 construction era and older condition/finish relative to newer comparables. | ||||||||||||||
| 1124 Bugle Point Rd | 2020 (6 yrs) | $1,200,000 | 2,928 | $409.84 | $252 | $737,856 | 20 | $10,000 | — | $10,000 | $200,000 | $937,856 | $262,144 | 28.0% |
| 88 Alder Creek Loop Rd | 2022 (4 yrs) | $2,200,000 | 3,624 | $607.06 | $252 | $913,248 | 100 | $7,500 | — | $7,500 | $750,000 | $1,663,248 | $536,752 | 32.3% |
The above three properties establish a baseline for the current St. Maries market. Each has been evaluated under the same framework, separating land market value, view premium and residence market value. This framework can now be applied to Benewah Estate.
The Offer
Supported by the Market.
Priced Below It.
With the St. Maries market established, the same framework is used to value Benewah Estate.
Benewah Estate Market Value Estimate
| Market Average Rates | Market Average Value | ||||
|---|---|---|---|---|---|
| Acres / SF | Base Rate | Premium | Total Rate | Value | |
| Residence Market Value | 2,790 SF | $252/SF | — | — | $703,080 |
| Land at Market Avg | 90 ac | $7,500/ac | — | — | $675,000 |
| View Premium · Cul-de-Sac | 10 ac | $7,500/ac | $6,500/ac | $14,000/ac | $140,000 |
| View Premium · Panoramic Amphitheater | 20 ac | $7,500/ac | $8,500/ac | $16,000/ac | $320,000 |
| Land Market Value | 120 ac | $1,135,000 | |||
| Total Market Value | $1,838,080 | ||||
| Less List Price | −$1,750,000 | ||||
| Below Market Value Difference | $88,080· 4.8% | ||||
The View Premium
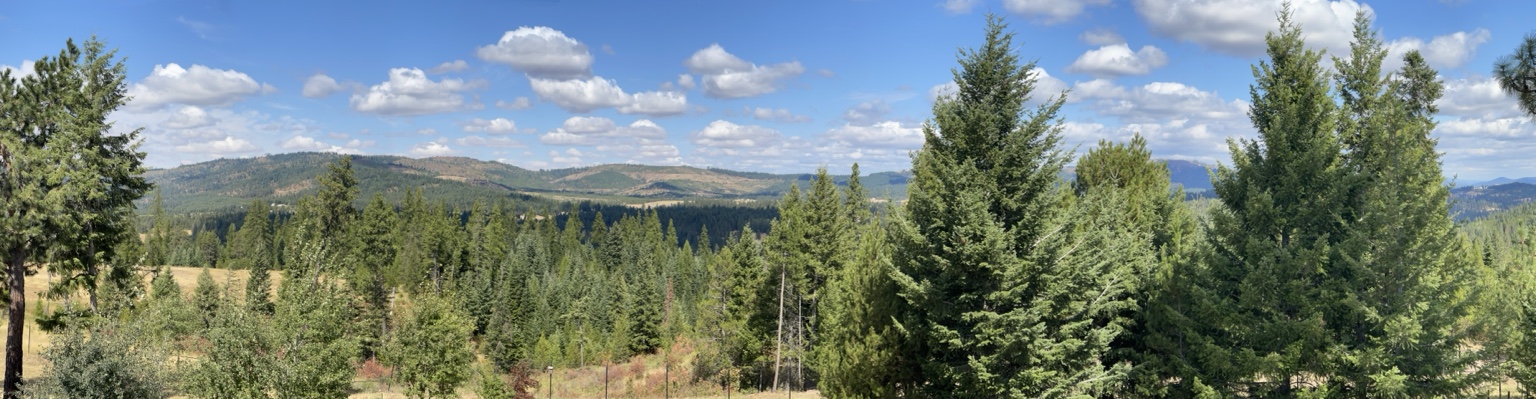
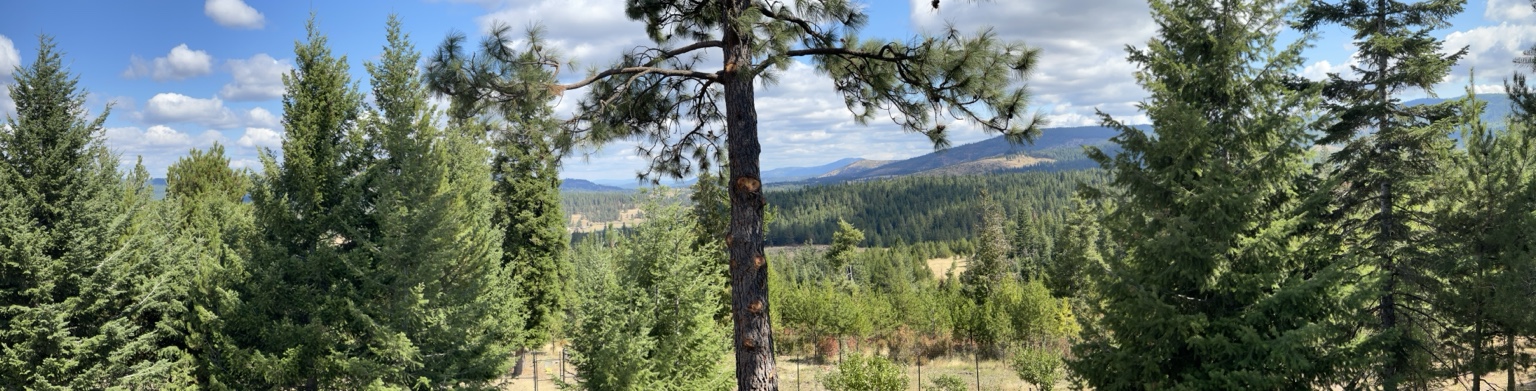
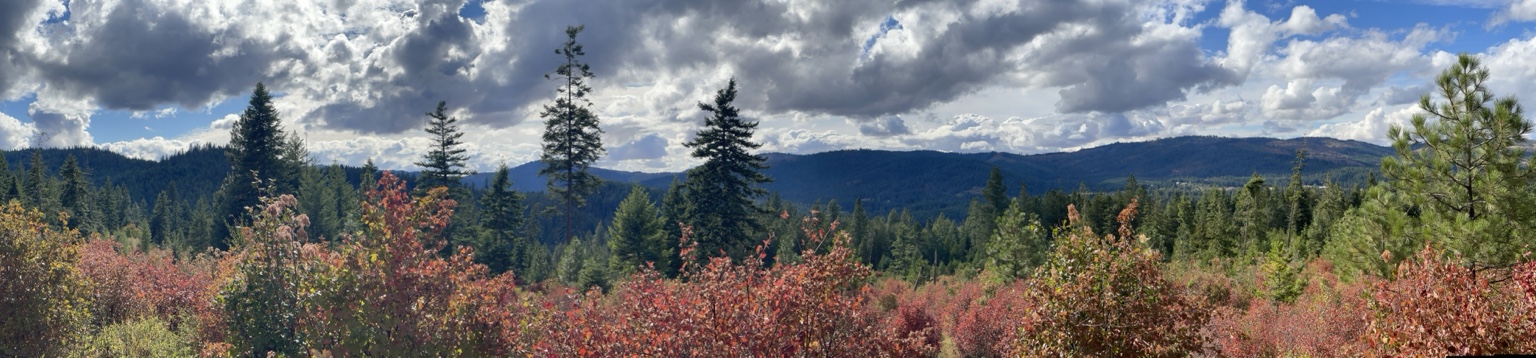
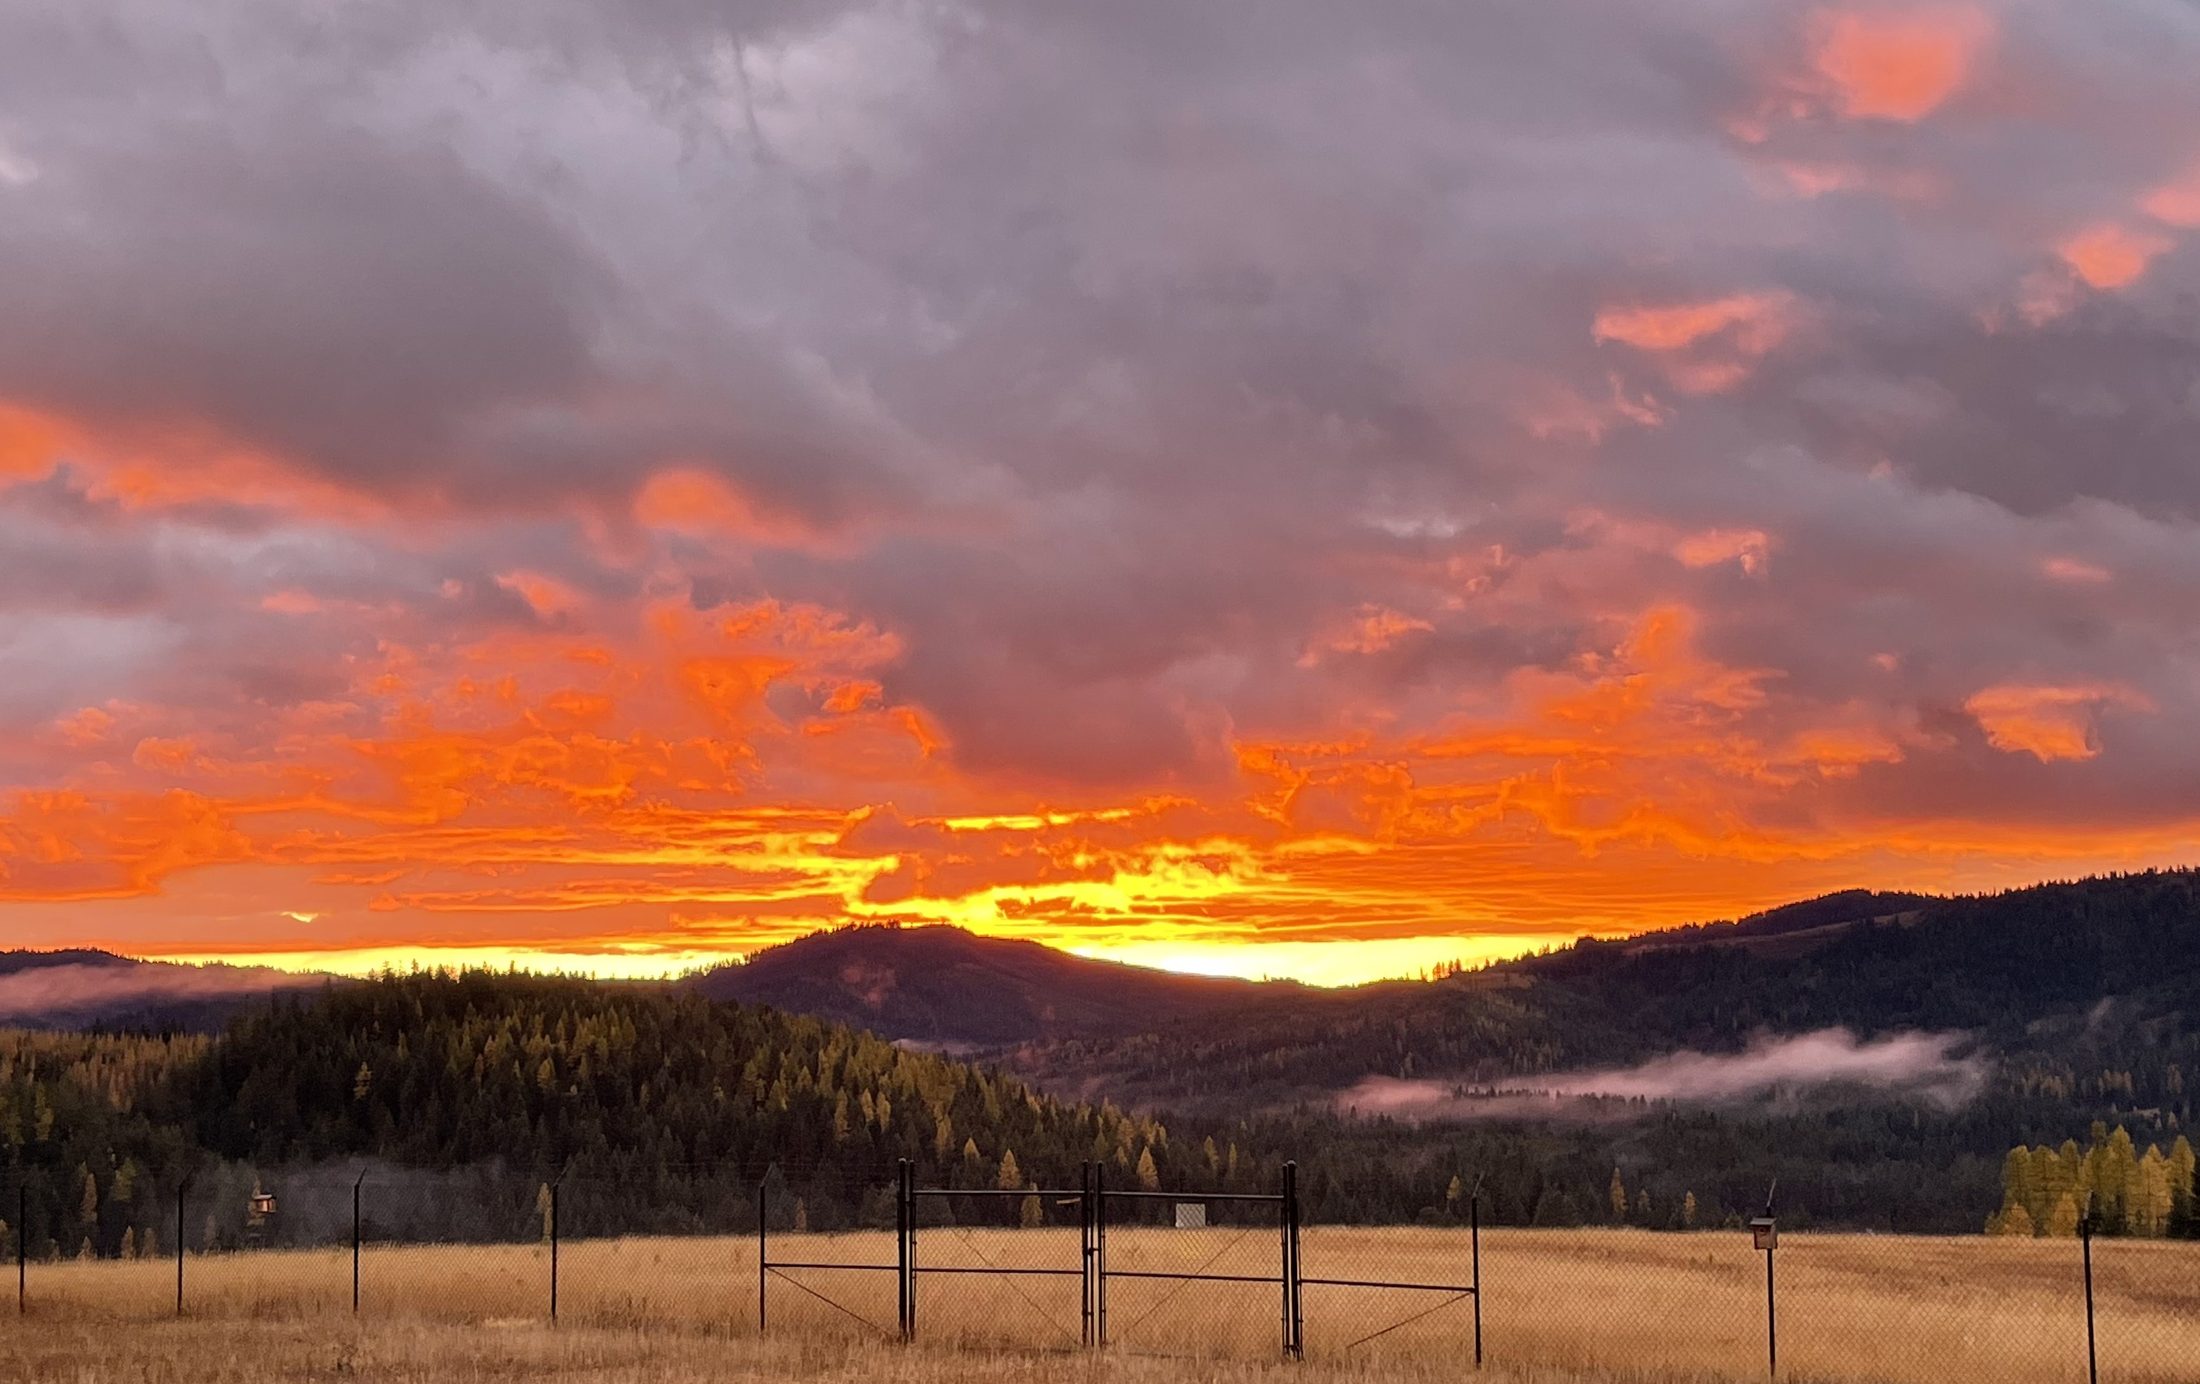
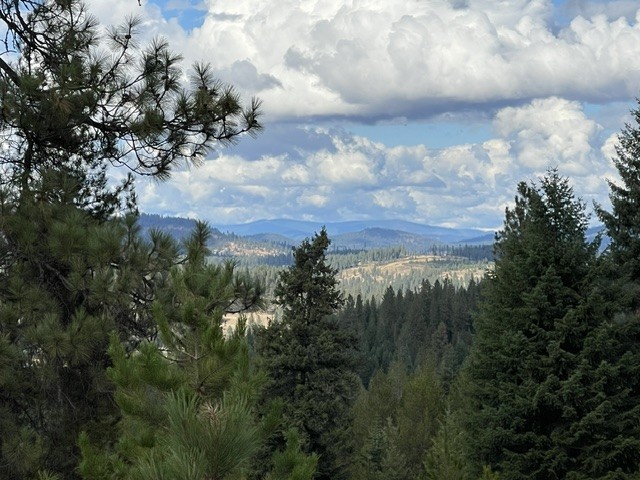
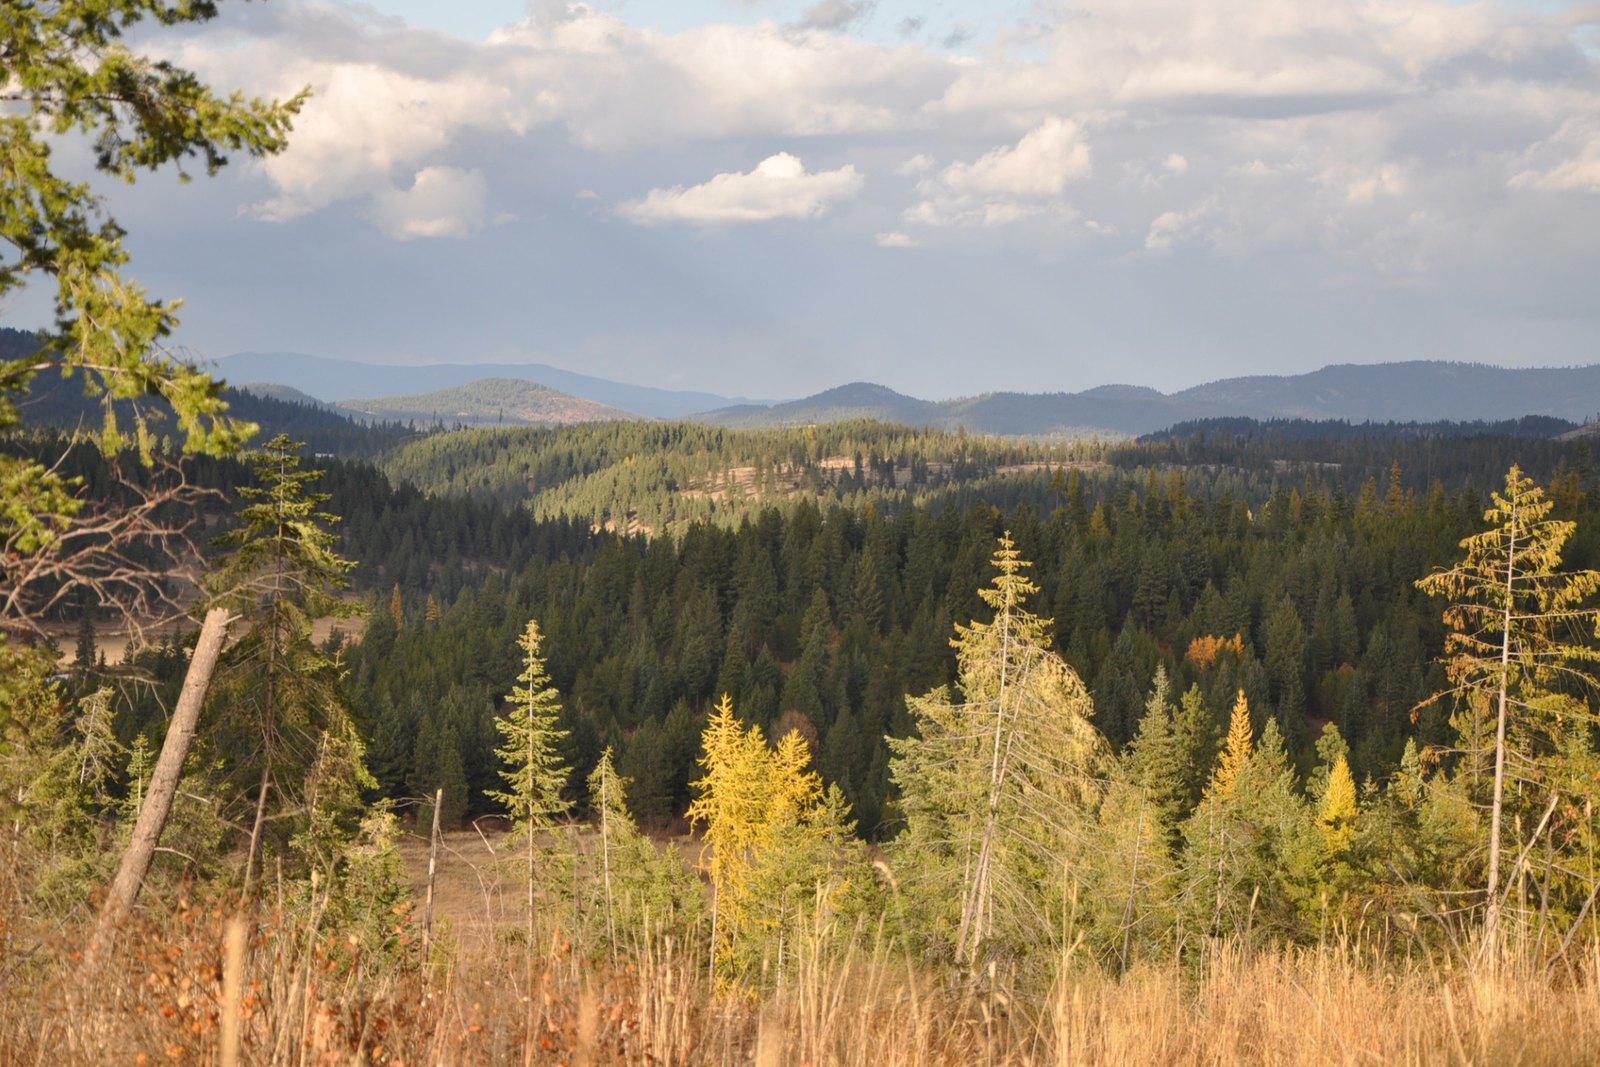
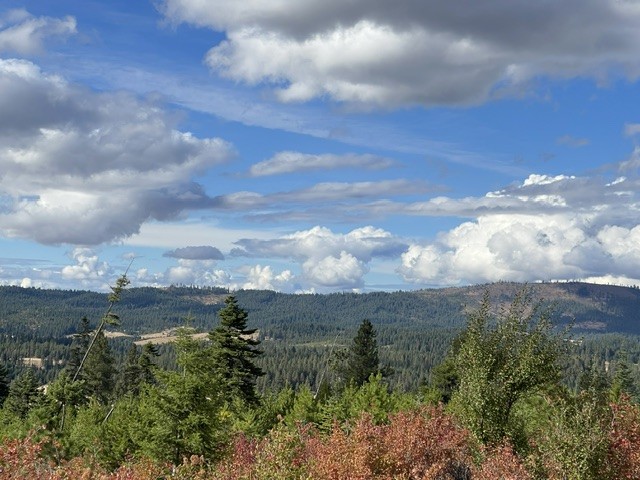
Panoramic views extend from the residence across the surrounding acreage, with multiple vantage points capturing the property’s layered ridgelines and mountain setting. Horizon calculations from locations across the estate support sightlines extending roughly 40 miles, with northern summits rising above 6,000'.
List Price
The Market Test
Same Method.
Now Add Benewah Estate.
Of the four properties, Benewah Estate is the only one whose list price falls below its total market value under the same methodology.
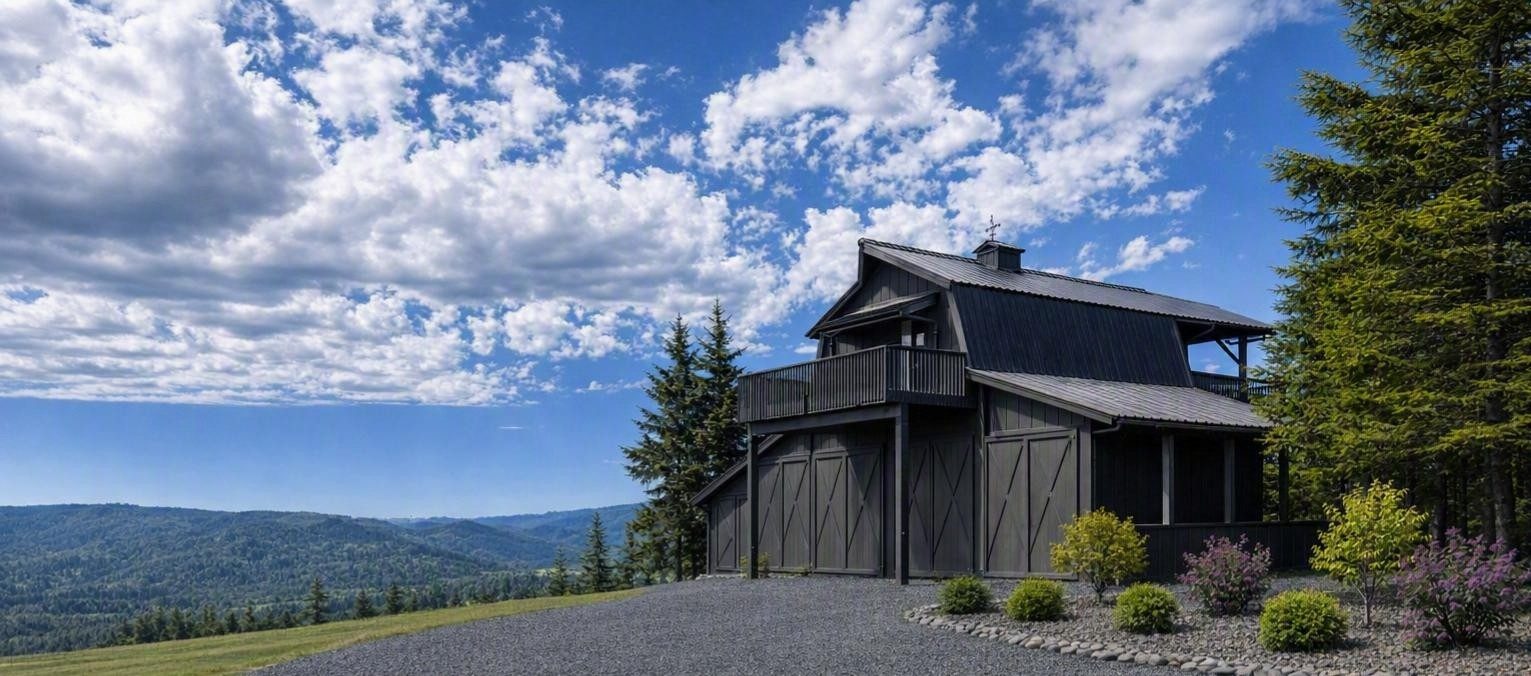
Benewah Estate
Subject Property$1,750,000
2,790 SF · $627/SF · 120 Acres · $14.6K/acre
Built 2026 · New
Explore the Estate →View-Premium Support
Benewah Estate’s view premium is supported by both sold-market evidence and measured sightline geometry. Premium rates were benchmarked against sold properties with comparable views. Separately, azimuth and horizon calculations from the estate’s ~3,100' ridgeline document unobstructed sightlines extending ~40 miles to summits including Latour Peak (6,408 ft), Reeds Baldy (6,153 ft), St. Joe Baldy (5,824 ft) and Bald Mountain (5,338 ft).
Market Value Estimate vs. List Price
| Listing | Residence at Market Avg | Land at Market Avg | List Premium | |||||||||||
|---|---|---|---|---|---|---|---|---|---|---|---|---|---|---|
| Address | Year Built | List Price | Residence SF | $/SF | Market $/SF | Residence At Market Avg |
Acreage | Mkt Avg $/acre | View Premium |
Total $/acre | Land Market Value |
Total at Market Avg | List Premium |
Premium |
| 1970 (56 yrs) | $825,000 | 3,646 | $226.28 | $150* | $546,900 | 2.3 | $10,000 | $69,000 | $40,000 | $92,000 | $638,900 | $186,100 | 29.1% | |
| Detail | Acres | Base Rate | Premium | Total Rate | Land Market Value | |||||||||
| Land at Market Avg | 2.3 | $10,000 | — | $10,000 | $23,000 | |||||||||
| View Premium · River View | 2.3 | — | $30,000 | $40,000 | $69,000 | |||||||||
| Land Subtotal | 2.3 | $92,000 | ||||||||||||
*Residence valued at $150/SF rather than the $252 market average, reflecting the 1970 construction era and older condition/finish relative to newer comparables. | ||||||||||||||
| 1124 Bugle Point Rd | 2020 (6 yrs) | $1,200,000 | 2,928 | $409.84 | $252 | $737,856 | 20 | $10,000 | — | $10,000 | $200,000 | $937,856 | $262,144 | 28.0% |
| 88 Alder Creek Loop Rd | 2022 (4 yrs) | $2,200,000 | 3,624 | $607.06 | $252 | $913,248 | 100 | $7,500 | — | $7,500 | $750,000 | $1,663,248 | $536,752 | 32.3% |
| 2026 (New) | $1,750,000 | 2,790 | $627.24 | $252 | $703,080 | 120 | $7,500 | $235,000 | $9,458 | $1,135,000 | $1,838,080 | ($88,080) | 4.8% Below | |
| Detail | Acres | Base Rate | Premium | Total Rate | Land Market Value | |||||||||
| Land at Market Avg | 120 | $7,500 | — | $7,500 | $900,000 | |||||||||
| View Premium · Cul-de-Sac | 10 | — | $6,500 | $14,000 | $65,000 | |||||||||
| View Premium · Panoramic Amphitheater | 20 | — | $8,500 | $16,000 | $170,000 | |||||||||
| Land Subtotal | 120 | $1,135,000 | ||||||||||||
What the Market Has Not Yet Priced
The Estate Is Already Here.
The Premium Is Not.
The regional evidence points in one direction. St. Maries is not outside the Pacific Northwest’s destination-market trajectory. It is merely earlier.
At Benewah Estate, the opportunity lies in the gap between what the estate already offers and what the market has priced in.
Near the growth, not fully in it.
The Renewable Energy System
MIT-Inspired Solar.
Power of Its Own.
Explore the Renewable Energy System →
Data Sources & Methodology
Historical population totals and regional growth rates are sourced from the U.S. Census Bureau. Migration trends reflect IRS Statistics of Income county-to-county tax-filing flow datasets and Census state-to-state flow estimates. Historical real-estate price metrics and land values are synthesized from regional MLS records, Zillow historical analytics and county parcel and assessment records. Active listings are listing-price market data, not an appraisal.
2026 figures are indicative market values synthesized from current listings, available MLS-derived market data, historical listing analytics, and county parcel records. Large-tract figures reflect 40–120-acre market observations and broader local land evidence. Because acreage varies materially by access, water, topography, entitlements, utilities and improvements, the figures are directional market observations—not appraisals or statistical measures of a uniform parcel class.